Exploring the Titanic Dataset

Introduction
In this exercise, we will explore the Titanic dataset. The dataset provides information about the passengers on the Titanic, which sank on its maiden voyage in 1912. Understanding the dataset is the first step towards any data analysis or machine learning task.
Objectives
-
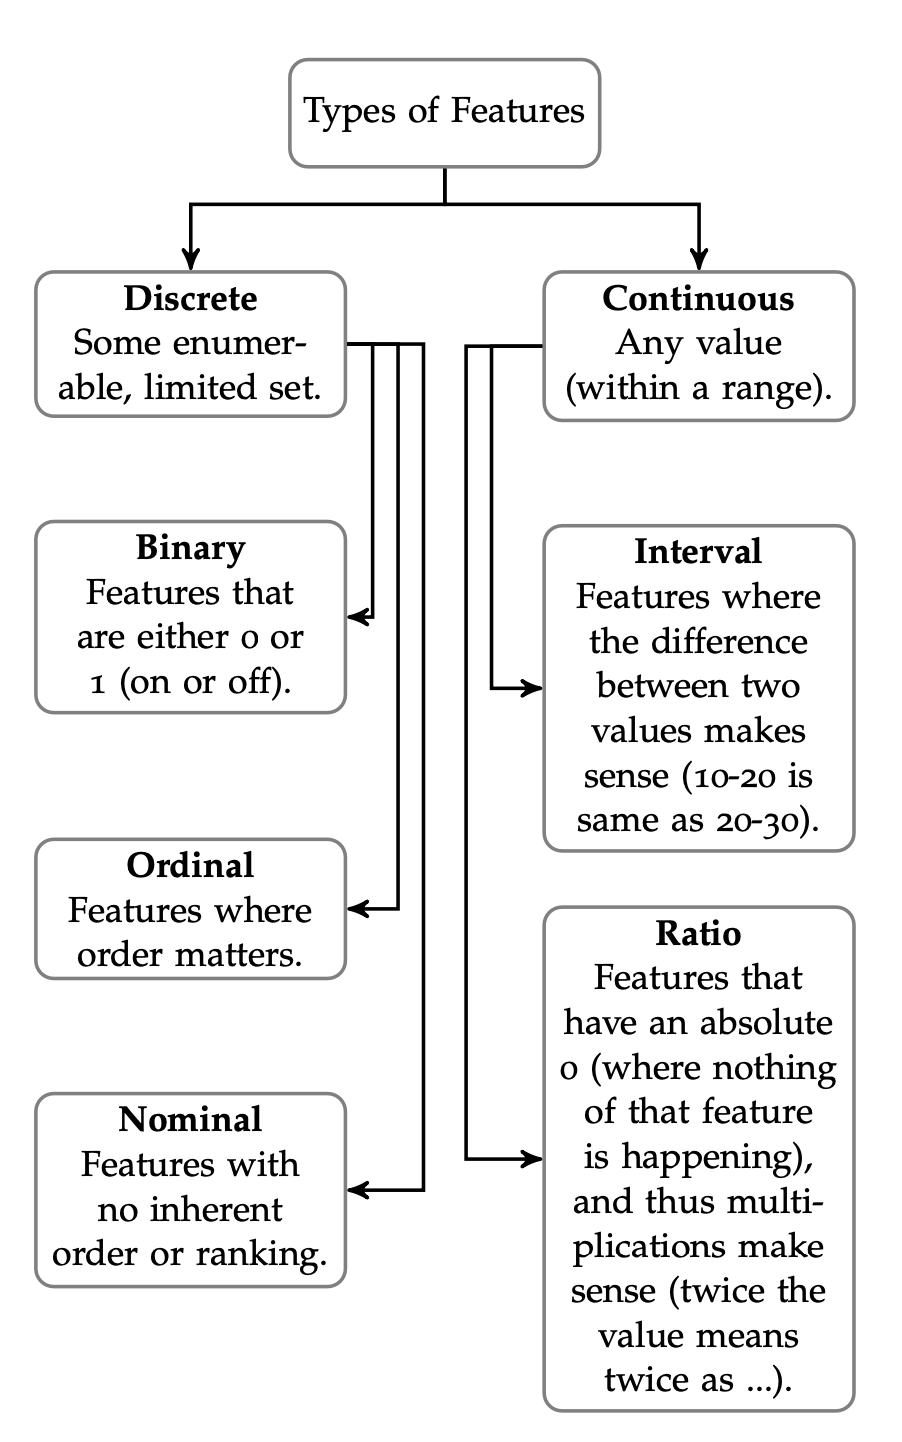
Discover the Features and Their Types: The first objective is to familiarize yourself with the features of the Titanic dataset and classify them according to the types discussed in the course. This includes identifying whether the features are numerical, categorical, ordinal, continuous, or discrete.
-
Conduct Exploratory Data Analysis (EDA) to Discover Patterns: The second objective is to perform an Exploratory Data Analysis (EDA) on the dataset. Through this process, you’ll explore the data to uncover patterns, relationships, and insights that could be significant for further analysis or predictive modeling.
Task 1: Understanding Your Data
Your first task is to understand the data and its attributes. So:
- Begin by visiting the Titanic dataset description to familiarize yourself with the context and the features available in the dataset.
You’re main quesiton to load the data as a Pandas Dataframe and get how many passengers are in the data?
One important step is to finish 10 minutes to pandas.
Task 2: Attributes Classification.
For each attribute in the dataset. You should assign its type.

Task 3: Data Discovery
- How much of the data are we missing?
- Do you see any features that you do not understand the values of?
- Which information could we potentially use to determine the crew of the Titanic in this dataset?
Those question are intended only after finishing the lecture on data visualisation.
Task 4: Survival rate by class.
The objective it to visualise the evolution of the survival rate for each class Pclass.
- Generate a plot that thow the survival rate for each class in the dataset.
Task 5: Survival rate by Sex.
- The main question is to determine if women have a higher survival rate than men.
Your answer should be back-up by a plot showing the two rates.
Task 5: Box plot
The objective of those question is to study the releation between two attributes using a boxplot. You goal is to show a box plot for each of the following cases:
- Set Sex to x, and Pclass to y. What can you conclude?
- Set Age to x, and Fare to y. Do these features correlate?
- Split the above plot by Survived, do you see a pattern in the data?
