Clustering
Download [attachment]
Late Policy
- You have free 8 late days.
- You can use late days for assignments. A late day extends the deadline 24 hours.
- Once you have used all 8 late days, the penalty is 10% for each additional late day.
Cluster Analysis
Cluster analysis seeks to partition the input data into groups of closely related instances so that instances that belong to the same cluster are more similar to each other than to instances that belong to other clusters. In this tutorial, we will provide examples of using different clustering techniques provided by the scikit-learn library package.
K-means Clustering
The k-means clustering algorithm represents each cluster by its corresponding cluster centroid. The algorithm would partition the input data into k disjoint clusters by iteratively applying the following two steps:
- Form k clusters by assigning each instance to its nearest centroid.
- Recompute the centroid of each cluster.
- In this section, we perform k-means clustering on a toy example of movie ratings dataset. We first create the dataset as follows
1
2
3
4
5
import pandas as pd
ratings = [['john',5,5,2,1],['mary',4,5,3,2],['bob',4,4,4,3],['lisa',2,2,4,5],['lee',1,2,3,4],['harry',2,1,5,5]]
titles = ['user','Jaws','Star Wars','Exorcist','Omen']
movies = pd.DataFrame(ratings,columns=titles)
movies
| user | Jaws | Star Wars | Exorcist | Omen | |
|---|---|---|---|---|---|
| 0 | john | 5 | 5 | 2 | 1 |
| 1 | mary | 4 | 5 | 3 | 2 |
| 2 | bob | 4 | 4 | 4 | 3 |
| 3 | lisa | 2 | 2 | 4 | 5 |
| 4 | lee | 1 | 2 | 3 | 4 |
| 5 | harry | 2 | 1 | 5 | 5 |
In this example dataset, the first 3 users liked action movies (Jaws and Star Wars) while the last 3 users enjoyed horror movies (Exorcist and Omen). Our goal is to apply k-means clustering on the users to identify groups of users with similar movie preferences.
Question 1:
- Drop the user column from the dataset.
- Declare a Kmean classifier with two centers.
- Adapt the classifier to the data.
- Create a DataFrame
labelsthat show the class for each user. - Create a DataFrame
centroidsthat shows the coordinates for each center with respect to the data columns.
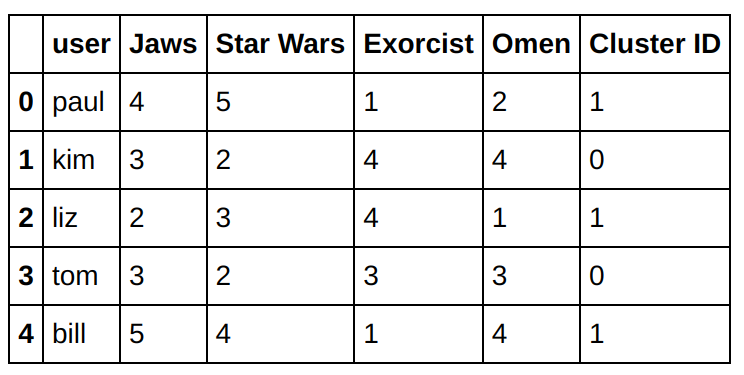
The cluster centroids can be applied to other users to determine their cluster assignments. Let’s show the result for this new users.
1
2
3
4
5
6
7
8
9
10
import numpy as np

testData = np.array([[4,5,1,2],[3,2,4,4],[2,3,4,1],[3,2,3,3],[5,4,1,4]])
labels = k_means.predict(testData)
labels = labels.reshape(-1,1)
usernames = np.array(['paul','kim','liz','tom','bill']).reshape(-1,1)
cols = movies.columns.tolist()
cols.append('Cluster ID')
newusers = pd.DataFrame(np.concatenate((usernames, testData, labels), axis=1),columns=cols)
newusers
Question 2:
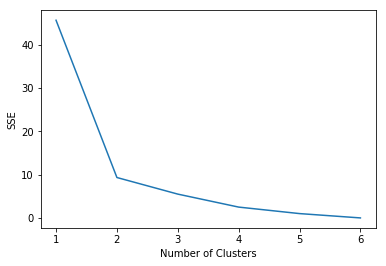
To determine the number of clusters in the data, we can apply k-means with varying number of clusters from 1 to 6 and compute their corresponding sum-of-squared errors (SSE) as shown in the example below. The “elbow” in the plot of SSE versus number of clusters can be used to estimate the number of clusters.
- Provide the code that compute the accuracy of the model for each value for $k$.
Read the documentation and try to gt the meaning for the field
interia_.
You should get a figure like this:
Hierarchical Clustering
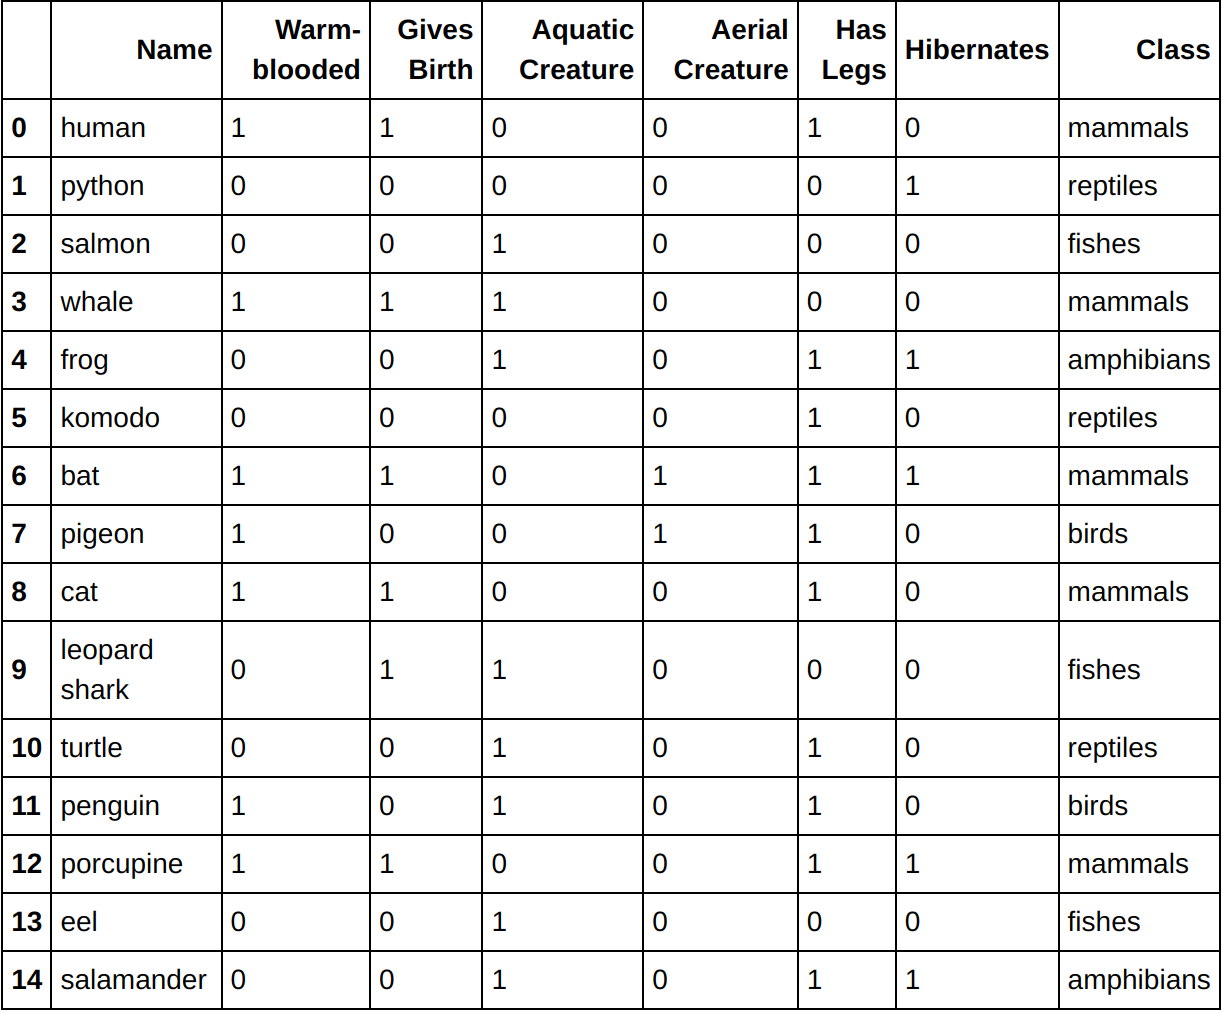
In this section we will see some examples of applying hierarchical clustering to the vertebrate dataset . Specifically, we illustrate the results of using 3 hierarchical clustering algorithms provided by the Python scipy library:
- single link (MIN)
- complete link (MAX),
- group average.
Other hierarchical clustering algorithms provided by the library include centroid-based and Ward’s method
Let’s import the data
1
2
3
4
import pandas as pd

data = pd.read_csv('vertebrate.csv',header='infer')
data
You should get the following data:
Single Link
First we will classify the data using clustring linkage to classify the data.
- Drop the
nameand theclassfrom the dataset. - Use the
linkagefunction withsingleargument to cluster the data. -
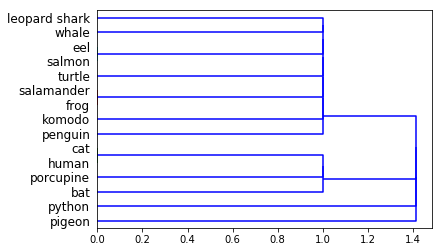
Show the classification tree using the
dendrogrammethod from the same module.You should get a figure like this one:
- Now, instead of
single, use thecompleteargument and see the result.
Density-Based Clustering
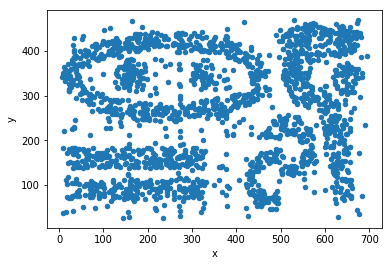
Density-based clustering identifies the individual clusters as high-density regions that are separated by regions of low density. DBScan is one of the most popular density based clustering algorithms. In DBScan, data points are classified into 3 types—core points, border points, and noise points—based on the density of their local neighborhood. The local neighborhood density is defined according to 2 parameters: radius of neighborhood size (eps) and minimum number of points in the neighborhood (min_samples).
For this approach, we will use a noisy, 2-dimensional dataset originally created by Karypis et al for evaluating their proposed CHAMELEON algorithm. The example code shown below will load and plot the distribution of the data CHAMELEON
Let’s show the dat
1
2
3
4
import pandas as pd

data = pd.read_csv('chameleon.data', delimiter=' ', names=['x','y'])
data.plot.scatter(x='x',y='y')
DBSCAN
First try to look on the documentation of DBSCAN
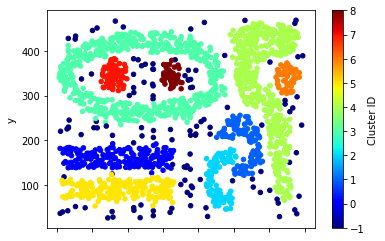
You should apply the DBScan clustering algorithm on the data by setting the neighborhood radius (eps) to 15.5 and minimum number of points (min_samples) to be 5. The clusters are assigned to IDs between 0 to 8 while the noise points are assigned to a cluster ID equals to -1. You should get results that are close to the this fugires which shows the differents parts of the chamelon.
